Aircraft Contrails – Observation and Prediction
Project
Autor: Finn Briegert
Date: 2024-03-14
Supervisor: Dieter Scholz
Abstract
Purpose – In this project contrails in the sky are observed. Their existence and persistence is compared with calculations. --- Methodology – Photos are taken of aircraft and of their contrails passing by in cruise. The contrails are categorized according to their lifespan. The website flightradar24.com is used to obtain flight data (altitude and temperature). Also, satellite images and contrail recordings were collected from other publicly available websites. The Schmidt-Appleman diagram and the Schmidt-Appleman criterion were used for predicting contrail existence and persistence. Input data is altitude, temperature, and relative humidity. Relative humidity was obtained via the website windy.com from the European Centre for Medium-Range Weather Forecasts (ECMWF). --- Findings – Contrails can be predicted with the method. For contrail lifespan three categories were defined: no contrails, transient contrails (lifespan of a few seconds up to five minutes), and persistent contrails. The lifespan of contrails was correctly categorized. --- Research Limitations – The observation took place with the naked eye and a smartphone camera. Accordingly, no observations could be made during the night. In addition, only a limited number of aircraft were observed. The resolution of the relative humidity is limited with respect to altitude and time. --- Practical Implications – A hands-on approach is presented, ready for everyone to apply. --- Social Implications – Contrails can be seen by everyone. Systematic contrail observations readily expose the aviation industry as fostering or boycotting avoidance of warming contrails. --- Originality – The well-known idea of contrail observation and prediction from the ground may have been deemed too simple and unworthy of science so far to be applied in a project.
Download full text
 TextBriegert.pdf
Size: 33M
URN, the Persistent Identifier (from the German National Library) to quote this Landing Page:
https://nbn-resolving.org/urn:nbn:de:gbv:18302-aero2024-03-14.019 
Entries into
- the German National Library (https://www.dnb.de),
- the Repository of Leibniz University Hannover (https://www.repo.uni-hannover.de) for the DOI,
- and the Internet Archive
will come later.
Associated research data: https://doi.org/10.7910/DVN/9DLURT

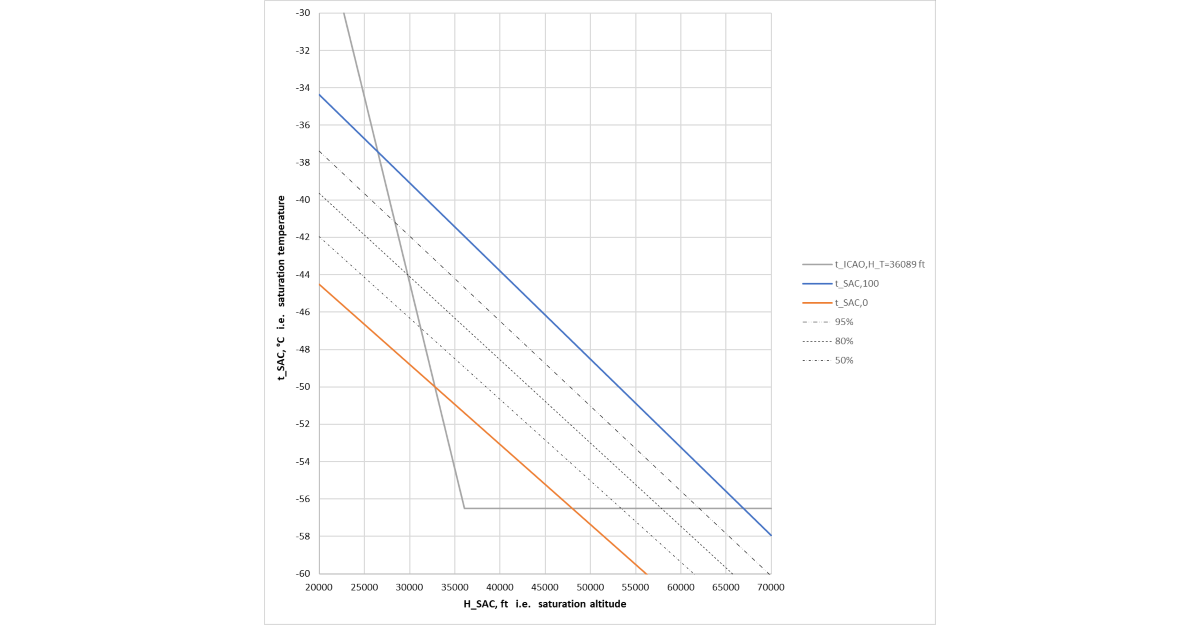
Screenshot of the Schmidt-Appleman-Diagram from own Excel-sheet (https://purl.org/aero/SAC).
The orange line represents the line for 0% relative humidity, the blue line for 100%.
In between there are lines for 50%, 80% and 95%. The full gray lines represent the ISA-Temperature, decreasing up to 36089 ft constant with -56.5 °C beyond that altitude.
If pressure and temperature conditions exist to the left of a humidity line, a contrail will form.
If pressure and temperature conditions exist to the right, no contrail is expected to form.
LAST UPDATE: 14 May 2024
AUTHOR: Prof. Dr. Scholz
IMPRESSUM (PDF)

 Prof. Dr. Scholz
 Aircraft Design and Systems Group (AERO)
 Aeronautical Engineering
 Department of Automotive and Aeronautical Engineering
 Faculty of Engineering and Computer Science
 Hamburg University of Applied Sciences


 TextBriegert.pdf
Size: 33M


 Prof. Dr. Scholz
 Aircraft Design and Systems Group (AERO)
 Aeronautical Engineering
 Department of Automotive and Aeronautical Engineering
 Faculty of Engineering and Computer Science
 Hamburg University of Applied Sciences